Gallery
This page shows images that were automatically generated by the command line tools installed with flydra. The command line used to generate each figure is shown. These figures also serve as unit tests for flydra – the stored versions are compared with newly generated versions whenever nosetests is run.
Image gallery
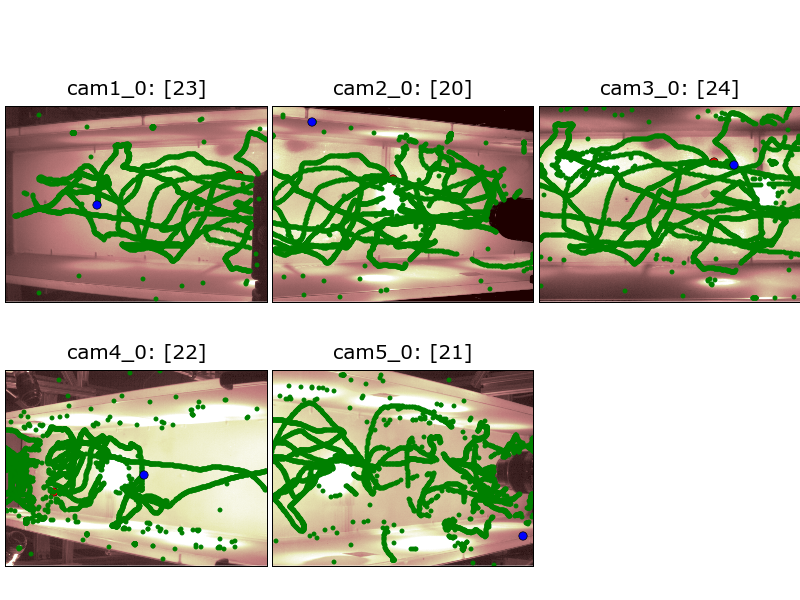
Camera view of 2D data
The following command generated this image:
flydra_analysis_plot_kalman_2d DATAFILE2D.h5 --save-fig=image.png

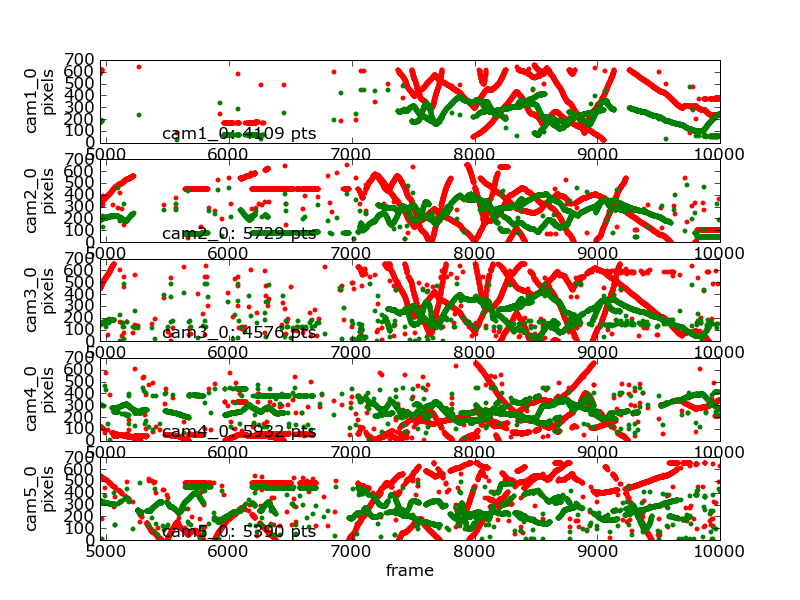
Timeseries of 2D data
The following command generated this image:
flydra_analysis_plot_timeseries_2d_3d DATAFILE2D.h5 --save-fig=image.png \
     --hide-source-name

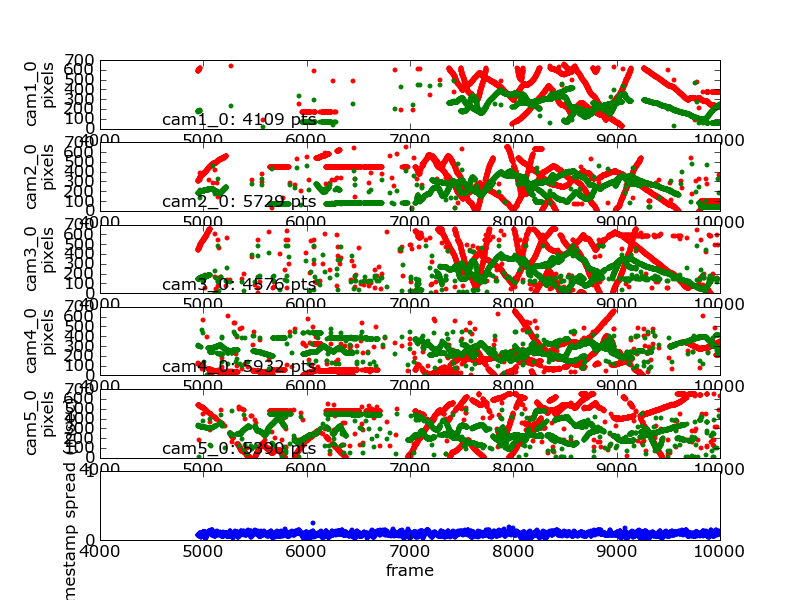
Timeseries of 2D data with frame synchronization data
The following command generated this image:
flydra_analysis_plot_timeseries_2d_3d DATAFILE2D.h5 \
     --spreadh5=DATAFILE2D.h5.spreadh5 --save-fig=image.png \
     --hide-source-name

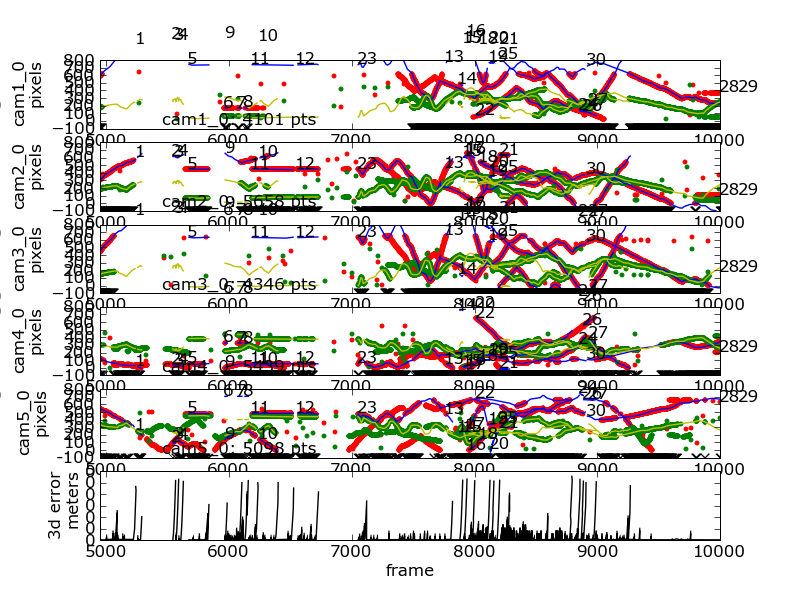
Timeseries of 2D and 3D data
The following command generated this image:
flydra_analysis_plot_timeseries_2d_3d DATAFILE2D.h5 \
     --kalman-file=DATAFILE3D.h5 --disable-kalman-smoothing \
     --save-fig=image.png --likely-only --hide-source-name
The --likely-only argument limits the 2D data plotted.

Command gallery
Re-run the data association algorithm
flydra_kalmanize DATAFILE2D.h5 --reconstructor=CALIBRATION.xml --max-err=10.0 \
     --min-observations-to-save=10 --dest-file=DATAFILE2D.kalmanized.h5
This re-runs the data association algorithm. It is useful to do this because the original realtime run may have skipped some processing to meet realtime constraints or because a better calibration is known. The new data are saved to an .h5 file named DATAFILE2D.kalmanized.h5.
Export data to MATLAB .mat file
flydra_analysis_data2smoothed DATAFILE3D.h5 --time-data=DATAFILE2D.h5 \
     --dest-file=DATAFILE3D_smoothed.mat
This produces a .mat file named DATAFILE3D_smoothed.mat. This file contains smoothed tracking data in addition to (unsmoothed) maximum likelihood position estimates.
Extract frame synchronization data
flydra_analysis_check_sync DATAFILE2D.h5 --dest-file=frame_sync_info.spreadh5
This produces a file named frame_sync_info.spreadh5 containing the spread of the timestamps in DATAFILE2D which may be plotted with flydra_analysis_plot_timeseries_2d_3d. Additionally, this command exits with a non-zero exit code if there are synchronization errors.